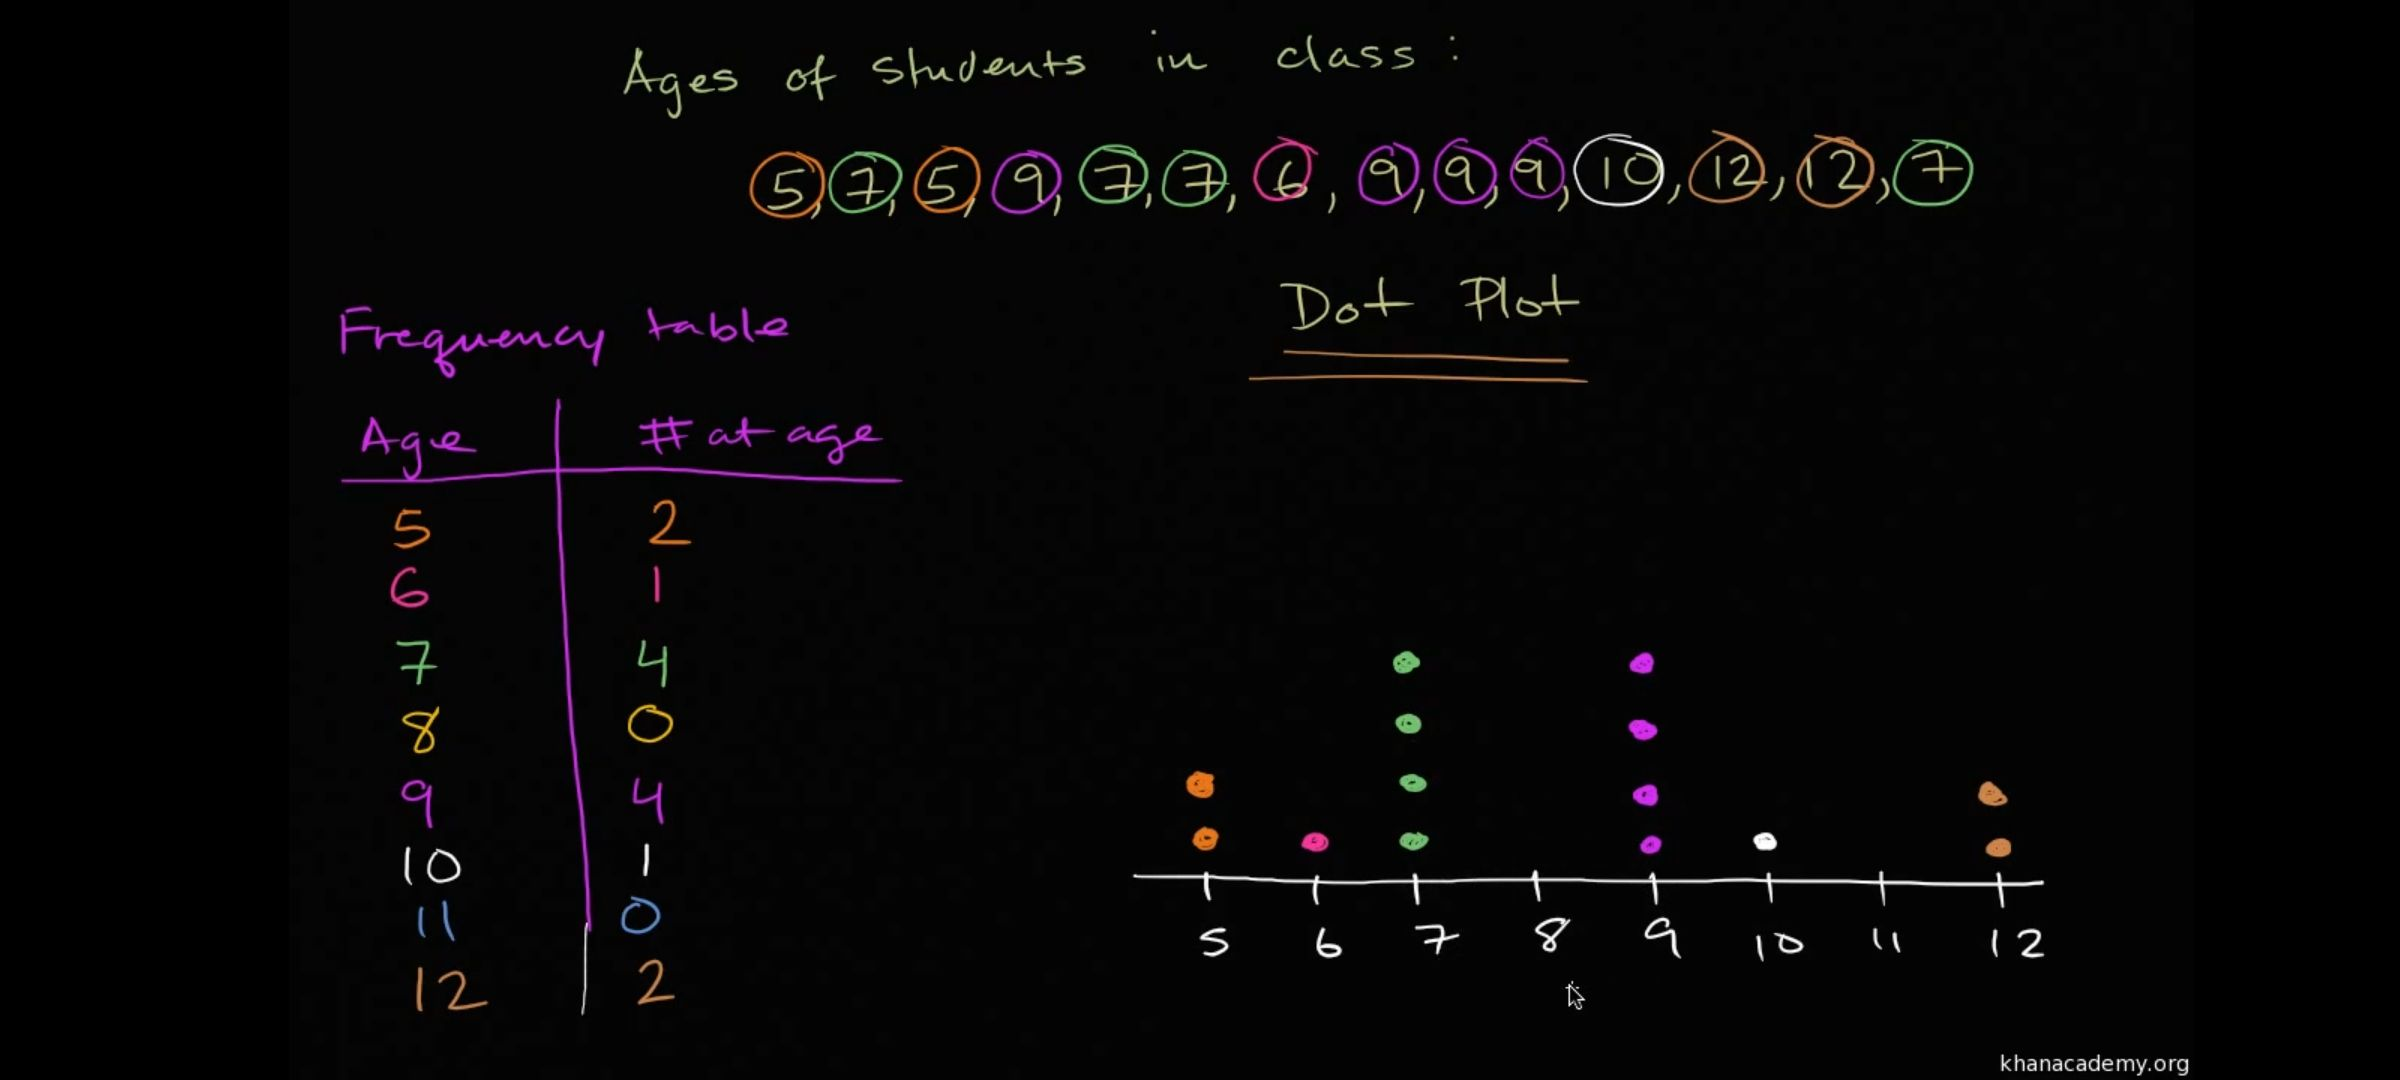
Frequency Tables show how often a value appears in a set of data.
Dot Plots provide a visual representation of information.
Bar graphs. Everyone knows what a bar graph is.
Frequency Tables show how often a value appears in a set of data.
Dot Plots provide a visual representation of information.
Bar graphs. Everyone knows what a bar graph is.